library(exams)
include_supplement("ad2stories.R", dir = "data") # necessary for includong object from other file
#sample parameters
n <- sample(20:30, size = 1) # number of data points
alpha <- sample(c(0.001, 0.01, 0.05, 0.1), size = 1) # significance level
#import stories
source("ad2stories.R", local = TRUE)
story <- sample(stories, size = 1)[[1]] # sample a story
#rename parameters for better readability
name <- story$name
text <- story$text
var <- story$var
unit <- story$unit
mu <- story$mu
sigma <- story$sigma
m <- story$m
c <- story$c
digit <- story$digit
#data generation (random, no real data)
x <- round(rnorm(n = n, mean = mu, sd = sigma), digits = digit)
y <- round(c + m * x + rnorm(n = n, mean = 0, sd = 5), digits = ifelse(name == "run_heart", digit - 1, digit)) #based on x but with variation
data <- data.frame(x, y)
names(data) <- var
#create necessary objects
model <- lm(y ~ x)
p_value <- coef(summary(model))[2, 4]
r2 <- summary(model)$r.squared
write.csv2(data, file = "ad2_data.csv")Advanced Example 2
This example includes numeric and single choice questions, a .csv-file with the data is generated and the concept of “stories” (see here for more information) is used.
The whole example as an .Rmd-file and the included story file can be downloaded here as a zip-archive:
Example Code
Note that the displayed code below is not highlighted as it would be in the downloaded file, so downloading it is recommended for better readability!
```{r data generation, echo=FALSE, results ='hide'}
library(exams)
include_supplement("ad2stories.R", dir = "data") # necessary for includong object from other file
#sample parameters
n <- sample(20:30, size = 1) # number of data points
alpha <- sample(c(0.001, 0.01, 0.05, 0.1), size = 1)
#import stories
source("ad2stories.R", local = TRUE)
story <- sample(stories, size = 1)[[1]] # sample a story
#rename parameters for better readability
name <- story$name
text <- story$text
var <- story$var
unit <- story$unit
mu <- story$mu
sigma <- story$sigma
m <- story$m
c <- story$c
digit <- story$digit
#data generation (random, no real data)
x <- round(rnorm(n = n, mean = mu, sd = sigma), digits = digit)
y <- round(c + m * x + rnorm(n = n, mean = 0, sd = 5), digits = ifelse(name == "run_heart", digit - 1, digit)) #based on x but with variation
data <- data.frame(x, y)
names(data) <- var
#create necessary objects
model <- lm(y ~ x)
p_value <- coef(summary(model))[2, 4]
r2 <- summary(model)$r.squared
write.csv2(data, file = "ad2_data.csv")
```
```{r questions/solutions, echo=FALSE, results = "hide"}
answers <- solutions <- explanations <- types <- list()
tolerances <- list()
#ind. var
answers[[1]] <- var # answer options stored in var
solutions[[1]] <- c(TRUE, FALSE)
types[[1]] <- "schoice"
#mean var1
answers[[2]] <- ""
solutions[[2]] <- mean(x)
types[[2]] <- "num"
tolerances[[2]] <- 0
#mean var2
answers[[3]] <- ""
solutions[[3]] <- mean(y)
types[[3]] <- "num"
tolerances[[3]] <- 0
# significant
answers[[4]] <- c("yes", "no")
solutions[[4]] <- if(p_value < alpha) c(TRUE, FALSE) else c(FALSE, TRUE)
types[[4]] <- "schoice"
# R^2
answers[[5]] <- ""
solutions[[5]] <- r2
types[[5]] <- "num"
tolerances[[5]] <- 3
# more/less variation
answers[[6]] <- c("more", "less")
solutions[[6]] <- c(TRUE, FALSE)
types[[6]] <- "schoice"
#perfect R^2
answers[[7]] <- c("1", "0")
solutions[[7]] <- c(TRUE, FALSE)
types[[7]] <- "schoice"
```
Question
=========
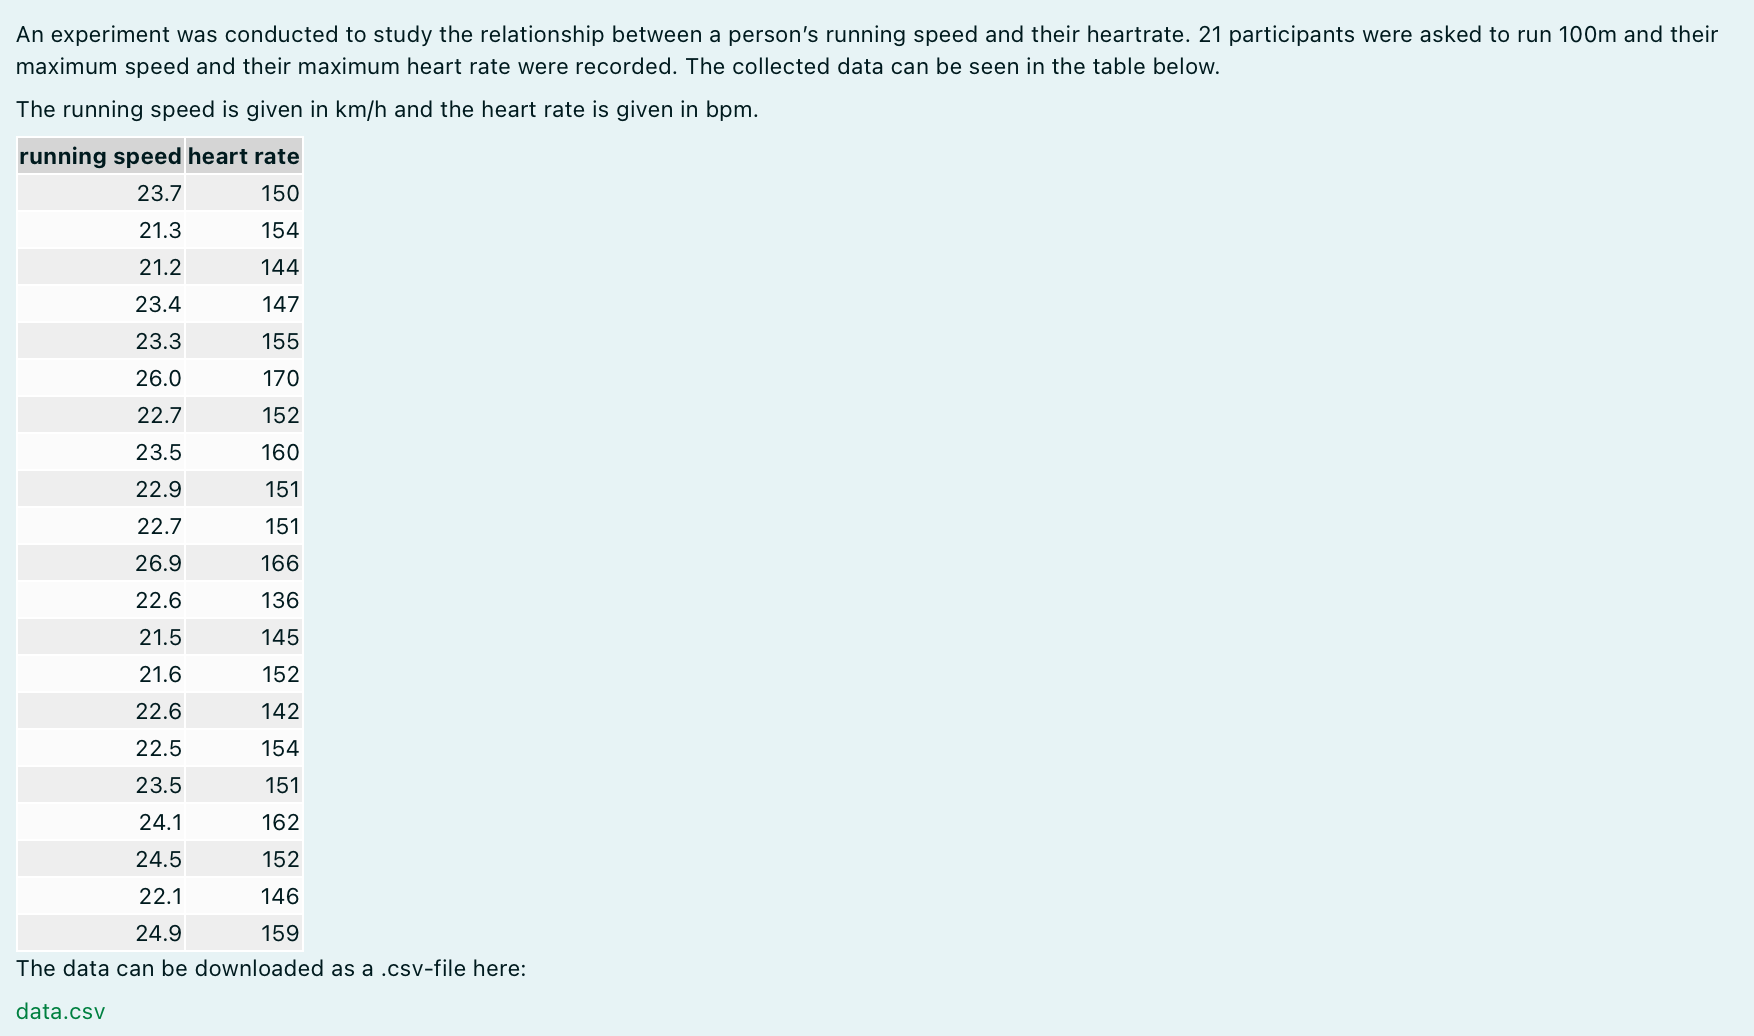
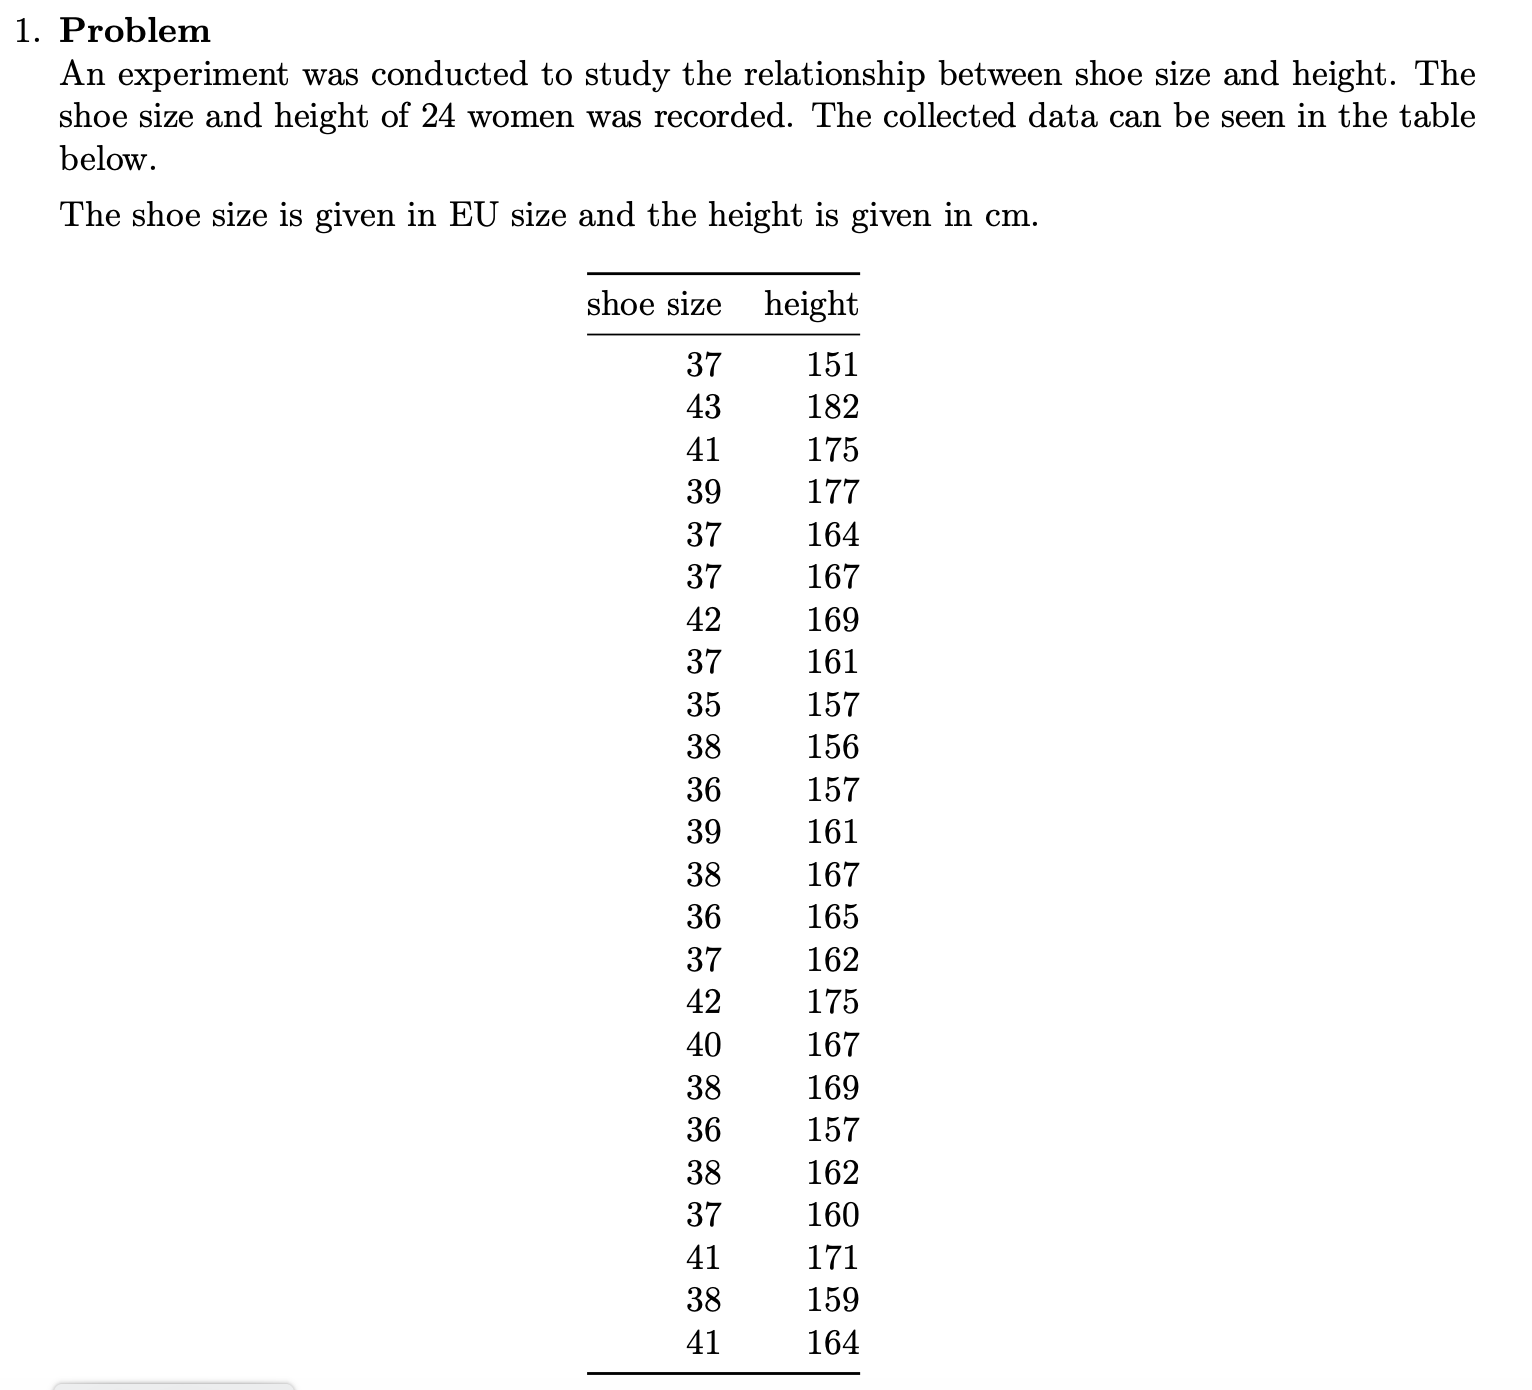
`r text` The collected data can be seen in the table below.
The `r var[1]` is given in `r unit[1]` and the `r var[2]` is given in `r unit[2]`.
```{r table, echo = FALSE, results="asis"}
knitr::kable(data, format = "markdown")
```
The data can be downloaded as a .csv-file here:
[data.csv](ad2_data.csv)
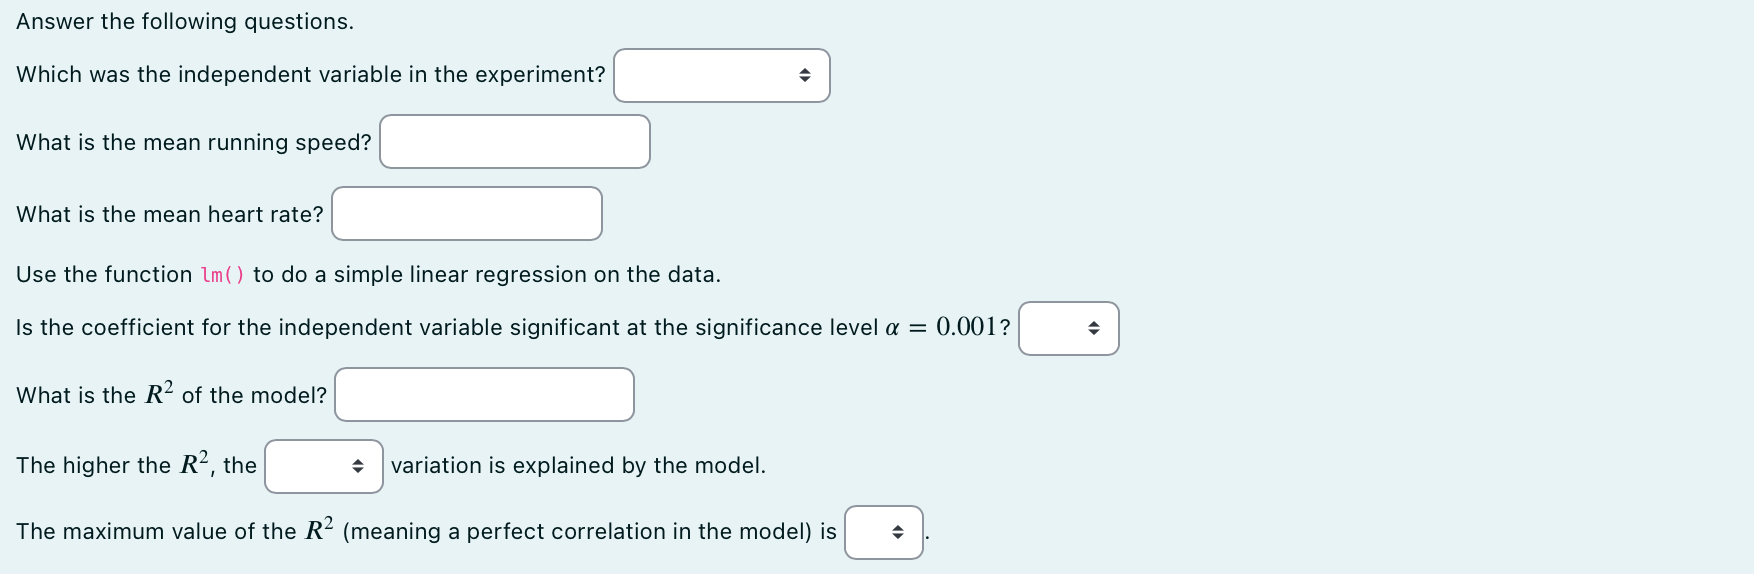
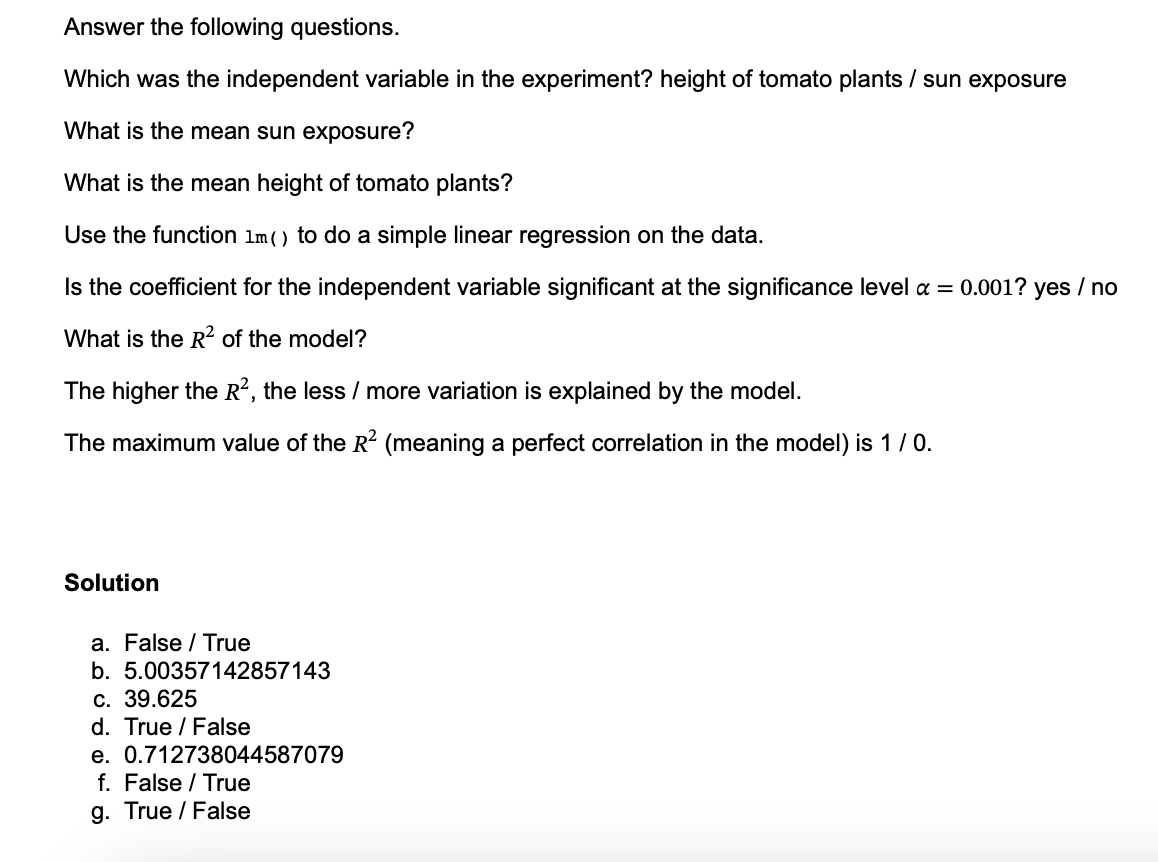
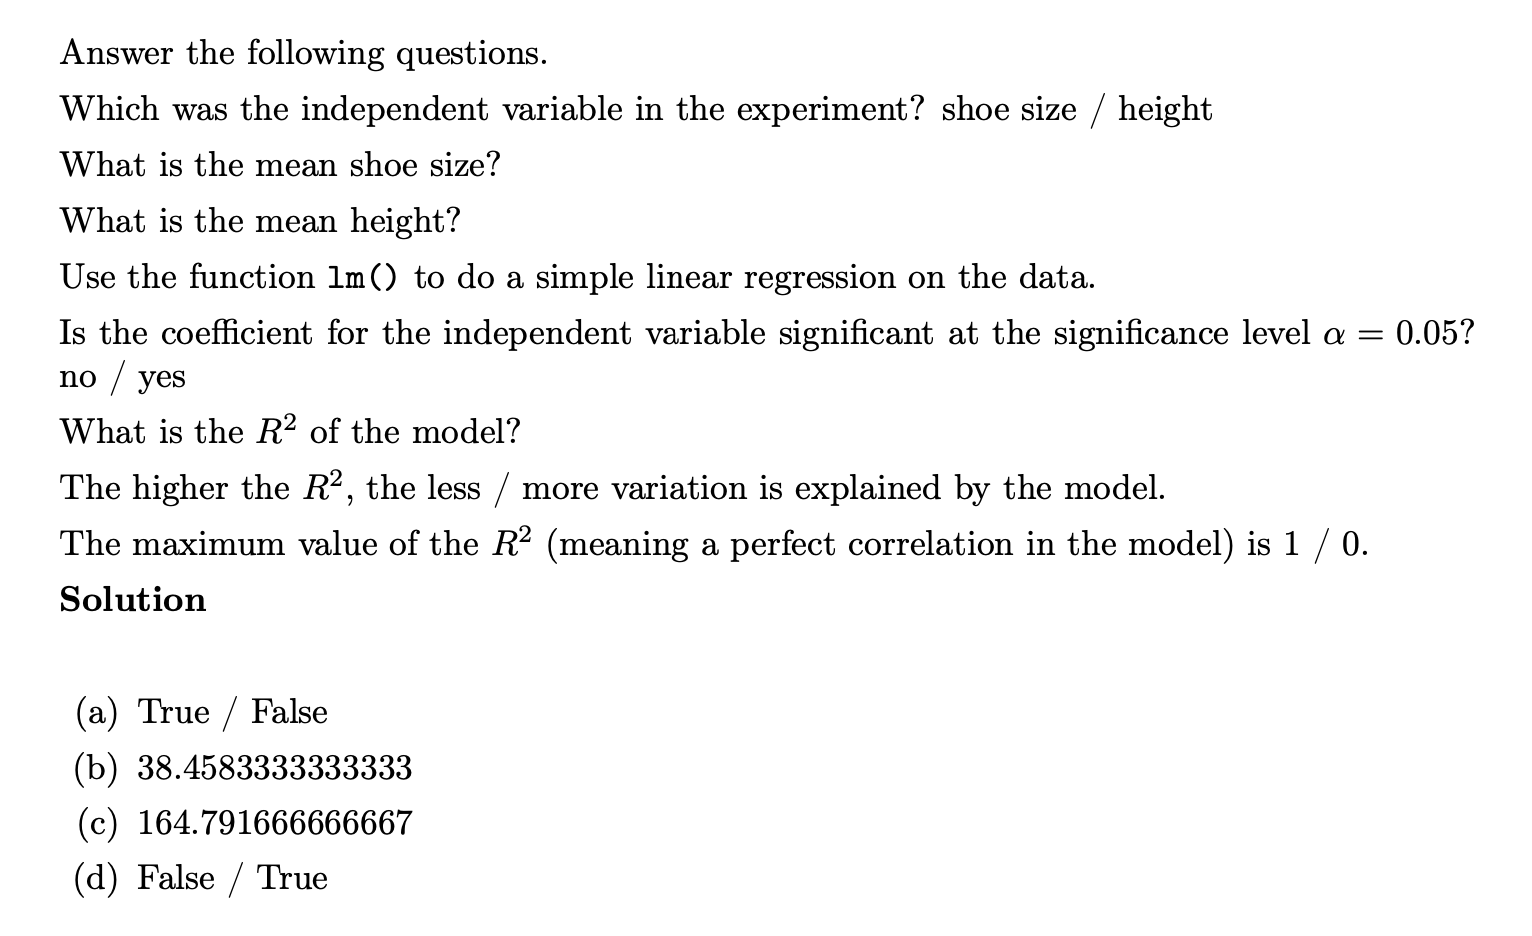
Answer the following questions.
Which was the independent variable in the experiment? ##ANSWER1##
What is the mean `r var[1]`? ##ANSWER2##
What is the mean `r var[2]`? ##ANSWER3##
Use the function `lm()` to do a simple linear regression on the data.
Is the coefficient for the independent variable significant at the significance level $\alpha = `r alpha`$? ##ANSWER4##
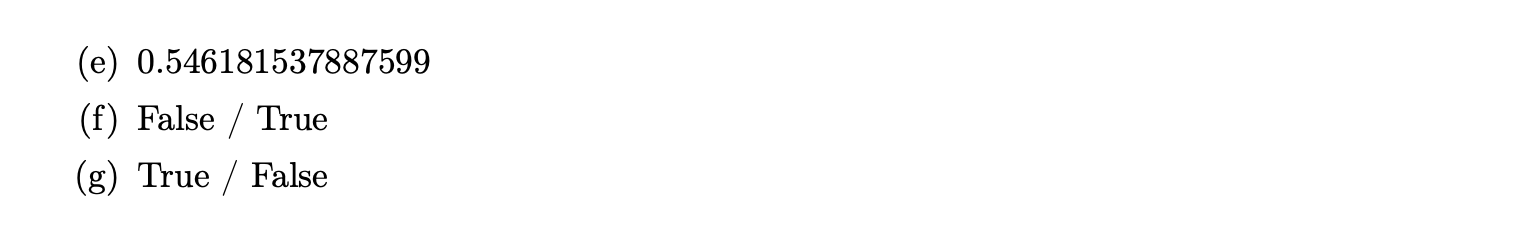
What is the $R^2$ of the model? ##ANSWER5##
The higher the $R^2$, the ##ANSWER6## variation is explained by the model.
The maximum value of the $R^2$ (meaning a perfect correlation in the model) is ##ANSWER7##.
```{r questionlist, echo = FALSE, results = "asis"}
# Numerical and text exercises require an empty answerlist entry
for (x in 1:length(types)) {
if (types[x] %in% c("num", "string")) {
answers[x] <- ""
}
}
answerlist(unlist(answers), markup = "markdown")
```
Solution
=========
```{r solutionlist, echo = FALSE, results = "asis"}
# Change the feedback format from a vector of T/F to strings
explanations <- list()
for (x in 1:length(solutions)) {
if (types[x] %in% c("schoice", "mchoice")) {
explanations[x] <- solutions[x] |> lapply(function(x) ifelse(x, "True", "False"))
} else {
explanations[x] <- solutions[x]
}
}
answerlist(unlist(explanations), markup = "markdown")
```
```{r meta, echo = FALSE, results = "hide"}
# Convert the format of single/multiple choice from T/F to 1/0
for (x in 1:length(solutions)) {
if (types[x] %in% c("schoice", "mchoice")) {
solutions[x] <- solutions[x] |>
unlist() |>
mchoice2string()
}
}
# Set all undefined tolerances to a default value
for (x in 1:length(solutions)) {
if (tolerances[x] |> unlist() |> is.null()) {
tolerances[x] <- 0
}
}
```
Meta-information
================
exname: Advanced Example 2
extitle: Advanced Example 2 `r name`
exsection: section_1/regression_exam
extype: cloze
exsolution: `r paste(solutions, collapse = "|")`
exclozetype: `r paste(types, collapse = "|")`
extol: `r paste(tolerances, collapse = "|")`
exshuffle: TRUE
exversion: v1
exextra[numwidth,numeric]: 16
exextra[stringwidth,numeric]: 16
After conversion with R/exams the exercise looks like this for different output types.

Data Generation
In order to use objects in R, which were created in a different file, in this case these are the stories, the following two functions are used: include_supplement() and source().
In the other file adstories.R the object stories is created, which contains several different contexts for the same exercise. So one of these stories is sampled randomly and then its parameters are used for creating the exercise. These parameters, such as “name”, “text”, “mu”, “sigma” etc. are stored in objects outside the story for convenience. Then data is generated according to this stories particular parameters. (Note, this process is completely arbitrary amd not based on real data). The data is stored in a data frame (later on a csv file is created). In this code chunk some necessary objects are also created from the regression output, which are part of the solutions later on.
Important
Code needs to be placed within a code chunk within in an .Rmd-file to work correctly and the “eval = FALSE”-tag needs to be removed.
Questions/ Solutions
This part defines the 5 lists, for answers, solutions and types, these are created individually in this section. Some of the tolerances and the explanations are created automatically later on.
Important
Code needs to be placed within a code chunk within in an .Rmd-file to work correctly and the “eval = FALSE”-tag needs to be removed.
answers <- solutions <- explanations <- types <- list()
tolerances <- list()

#ind. var
answers[[1]] <- var # answer options stored in var
solutions[[1]] <- c(TRUE, FALSE)
types[[1]] <- "schoice"

#mean var1
answers[[2]] <- ""
solutions[[2]] <- mean(x)
types[[2]] <- "num"
tolerances[[2]] <- 0

#mean var2
answers[[3]] <- ""
solutions[[3]] <- mean(y)
types[[3]] <- "num"
tolerances[[3]] <- 0

# significant
answers[[4]] <- c("yes", "no")
solutions[[4]] <- if(p_value < alpha) c(TRUE, FALSE) else c(FALSE, TRUE)
types[[4]] <- "schoice"

# R^2
answers[[5]] <- ""
solutions[[5]] <- r2
types[[5]] <- "num"
tolerances[[5]] <- 3

# more/less variation
answers[[6]] <- c("more", "less")
solutions[[6]] <- c(TRUE, FALSE)
types[[6]] <- "schoice"

#perfect R^2
answers[[7]] <- c("1", "0")
solutions[[7]] <- c(TRUE, FALSE)
types[[7]] <- "schoice"
Question
This section contains the main question text, which is dymamically adjusted based on the story using inline code (an explanation can be found here), the data, and the questions in this exercise.
The last code chunk fills in (possibly missing) placeholders for the answers list for numeric and string questions and formats the answer options correctly.
Question
=========

`r text` The collected data can be seen in the table below.

The `r var[1]` is given in `r unit[1]` and the `r var[2]` is given in `r unit[2]`.

```{r table, echo = FALSE, results="asis"}
knitr::kable(data, format = "markdown")
```

The data can be downloaded as a .csv-file here:

[data.csv](ad2_data.csv)

Answer the following questions.

Which was the independent variable in the experiment? ##ANSWER1##

What is the mean `r var[1]`? ##ANSWER2##

What is the mean `r var[2]`? ##ANSWER3##

Use the function `lm()` to do a simple linear regression on the data.

Is the coefficient for the independent variable significant at the significance level $\alpha = `r alpha`$? ##ANSWER4##

What is the $R^2$ of the model? ##ANSWER5##

The higher the $R^2$, the ##ANSWER6## variation is explained by the model.

The maximum value of the $R^2$ (meaning a perfect correlation in the model) is ##ANSWER7##.


```{r questionlist, echo = FALSE, results = "asis"}
# Numerical and text exercises require an empty answerlist entry
for (x in 1:length(types)) {
  if (types[x] %in% c("num", "string")) {
    answers[x] <- ""
  }
}

answerlist(unlist(answers), markup = "markdown")
```
Solution
The explanations are simply created from the solutions and displayed in this section. Additionally the format for choice questions is altered for the conversion and missing tolerances are set to 0.
Solution
=========

```{r solutionlist, echo = FALSE, results = "asis"}
# Change the feedback format from a vector of T/F to strings
explanations <- list()
for (x in 1:length(solutions)) {
  if (types[x] %in% c("schoice", "mchoice")) {
    explanations[x] <- solutions[x] |> lapply(function(x) ifelse(x, "True", "False"))
  } else {
    explanations[x] <- solutions[x]
  }
}

answerlist(unlist(explanations), markup = "markdown")
```

```{r meta, echo = FALSE, results = "hide"}
# Convert the format of single/multiple choice from T/F to 1/0
for (x in 1:length(solutions)) {
  if (types[x] %in% c("schoice", "mchoice")) {
    solutions[x] <- solutions[x] |>
      unlist() |>
      mchoice2string()
  }
}

# Set all undefined tolerances to a default value
for (x in 1:length(solutions)) {
  if (tolerances[x] |> unlist() |> is.null()) {
    tolerances[x] <- 0
  }
}

```
Meta Information
The meta-information contains all the necessary information for conversion. exsection is used for the import in Moodle and allows the exercises to be imported automatically in the specified category. The extra arguments regarding numwidth and stringwidth specify the length of the answer boxes that are shown in Moodle.
Meta-information
================
exname: Advanced Example 2
extitle: Advanced Example 2 `r name`
exsection: section_1/regression_exam
extype: cloze
exsolution: `r paste(solutions, collapse = "|")`
exclozetype: `r paste(types, collapse = "|")`
extol: `r paste(tolerances, collapse = "|")`
exshuffle: TRUE
exversion: v1