library(knitr) #load necessary package
library(exams)
#include_supplement(file = "bread.jpg", dir = "../images") #necessary for including images

set.seed(123) # seed for replicability -> removed when generating multiple differnt exercises !!!

# set parameters
x_mu <- 1000 #set true mean
alpha = 0.01 #confidence level
difference <- FALSE # should the means be different?
n <- 25 #number of observations


if(difference){ #define y_mu for sampling, is different from x_mu when the group means should be different
  y_mu <- x_mu + 20
} else {
  y_mu <- x_mu
}

# sample data
x <- round(rnorm(n = n, mean = x_mu, sd = 10), digits = 2) #data sampled and rounded
y <- round(rnorm(n = n, mean = y_mu, sd = 10), digits = 2)

#create "pretty" dataframe
data <- data.frame("Manufacturer_A" = x, "Manufacturer_B" = y)

#write a csv file with the data, available for download
write.csv2(data, file = "bread_data.csv")Advanced Example 1
This is an example about the mean weight of bread made by two manufacturers. It contains two numeric, two single choice and one multiple choice question. The exercise requires the calculation of two means and a t-test.
It uses several add-ons described here, such as:
- data sampling and inline code
- creating and providing a .csv-file containing the data for direct download within the exercise
- including a picture
The whole example as an .Rmd-file and the included image can be downloaded here:
Example Code
Note that the displayed code below is not highlighted as it would be in the downloaded file, so downloading it is recommended for better readability!
```{r, data generation}
library(knitr) #load necessary package
library(exams)
include_supplement(file = "bread.jpg", dir = "../images") #necessary for including a picture
set.seed(123) # seed for replicability -> removed when generating multiple differnt exercises !!!
# set parameters
x_mu <- 1000 #set true mean
alpha = 0.01 #confidence level
difference <- FALSE # should the means be different?
n <- 25 #number of observations
if(difference){ #define y_mu for sampling, is different from x_mu when the group means should be different
y_mu <- x_mu + 20
} else {
y_mu <- x_mu
}
# sample data
x <- round(rnorm(n = n, mean = x_mu, sd = 10), digits = 2) #data sampled and rounded
y <- round(rnorm(n = n, mean = y_mu, sd = 10), digits = 2)
#create "pretty" dataframe
data <- data.frame("Manufacturer_A" = x, "Manufacturer_B" = y)
#write a csv file with the data, available for download
write.csv2(data, file = "bread_data.csv")
```
```{r, question/solutionlist}
#define empty lists
answers <- list()
solutions <- list()
types <- list()
explanations <- list()
tolerances <- list()
# define certain objects (not necessary, but a cleaner workflow)
mean_x <- mean(x)
mean_y <- mean(y)
p_value <- t.test(x, y)$p.value
#mean manufacturer A
answers[[1]] <- "" #no answer options for numeric questions
solutions[[1]] <- mean_x
types[[1]] <- "num"
tolerances[[1]] <- 0.1 #tolerances only for numeric questions
#mean manufacturer B
answers[[2]] <- ""
solutions[[2]] <- mean_y
types[[2]] <- "num"
tolerances[[2]] <- 0.1
#null hypothesis
answers[[3]] <- c("the mean weight of the bread is the same for manufacturer A and B.", "the mean weight of the bread is different for manufacturer A and B.") #answer options for single choice
solutions[[3]] <- if(difference){ c(FALSE, TRUE)} else {c(TRUE, FALSE)} #answer dynamically adjusted depending on the parameters used
types[[3]] <- "schoice" # single choice
#p-value
answers[[4]] <- c("yes", "no", "not enough information in the output to answer")
solutions[[4]] <- if(p_value < alpha){ c(TRUE, FALSE, FALSE)} else{ c(FALSE, TRUE, FALSE)} # answer dynamically adjusted
types[[4]] <- "mchoice" # multiple choice
#reject/accept
answers[[5]] <- c("can reject the null hypothesis.", "cannot reject the null hypothesis.")
solutions[[5]] <- if(p_value < alpha){c(TRUE, FALSE)} else{c(FALSE, TRUE)}
types[[5]] <- "schoice"
```
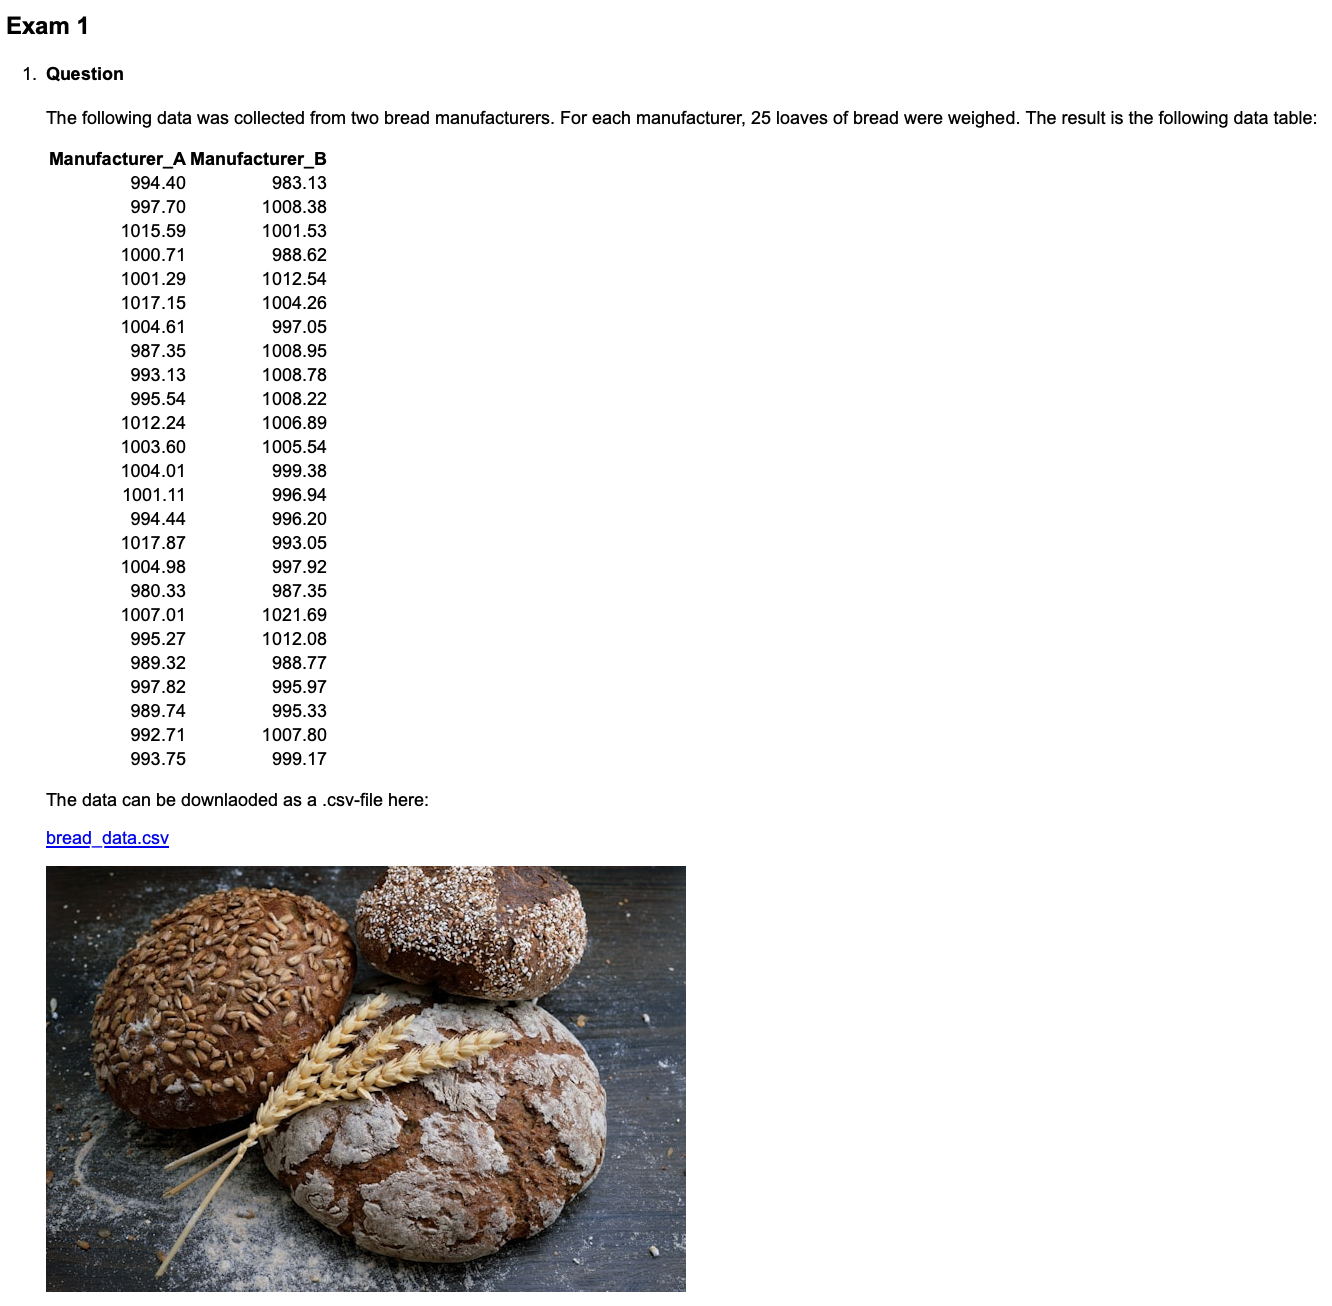
Question
========
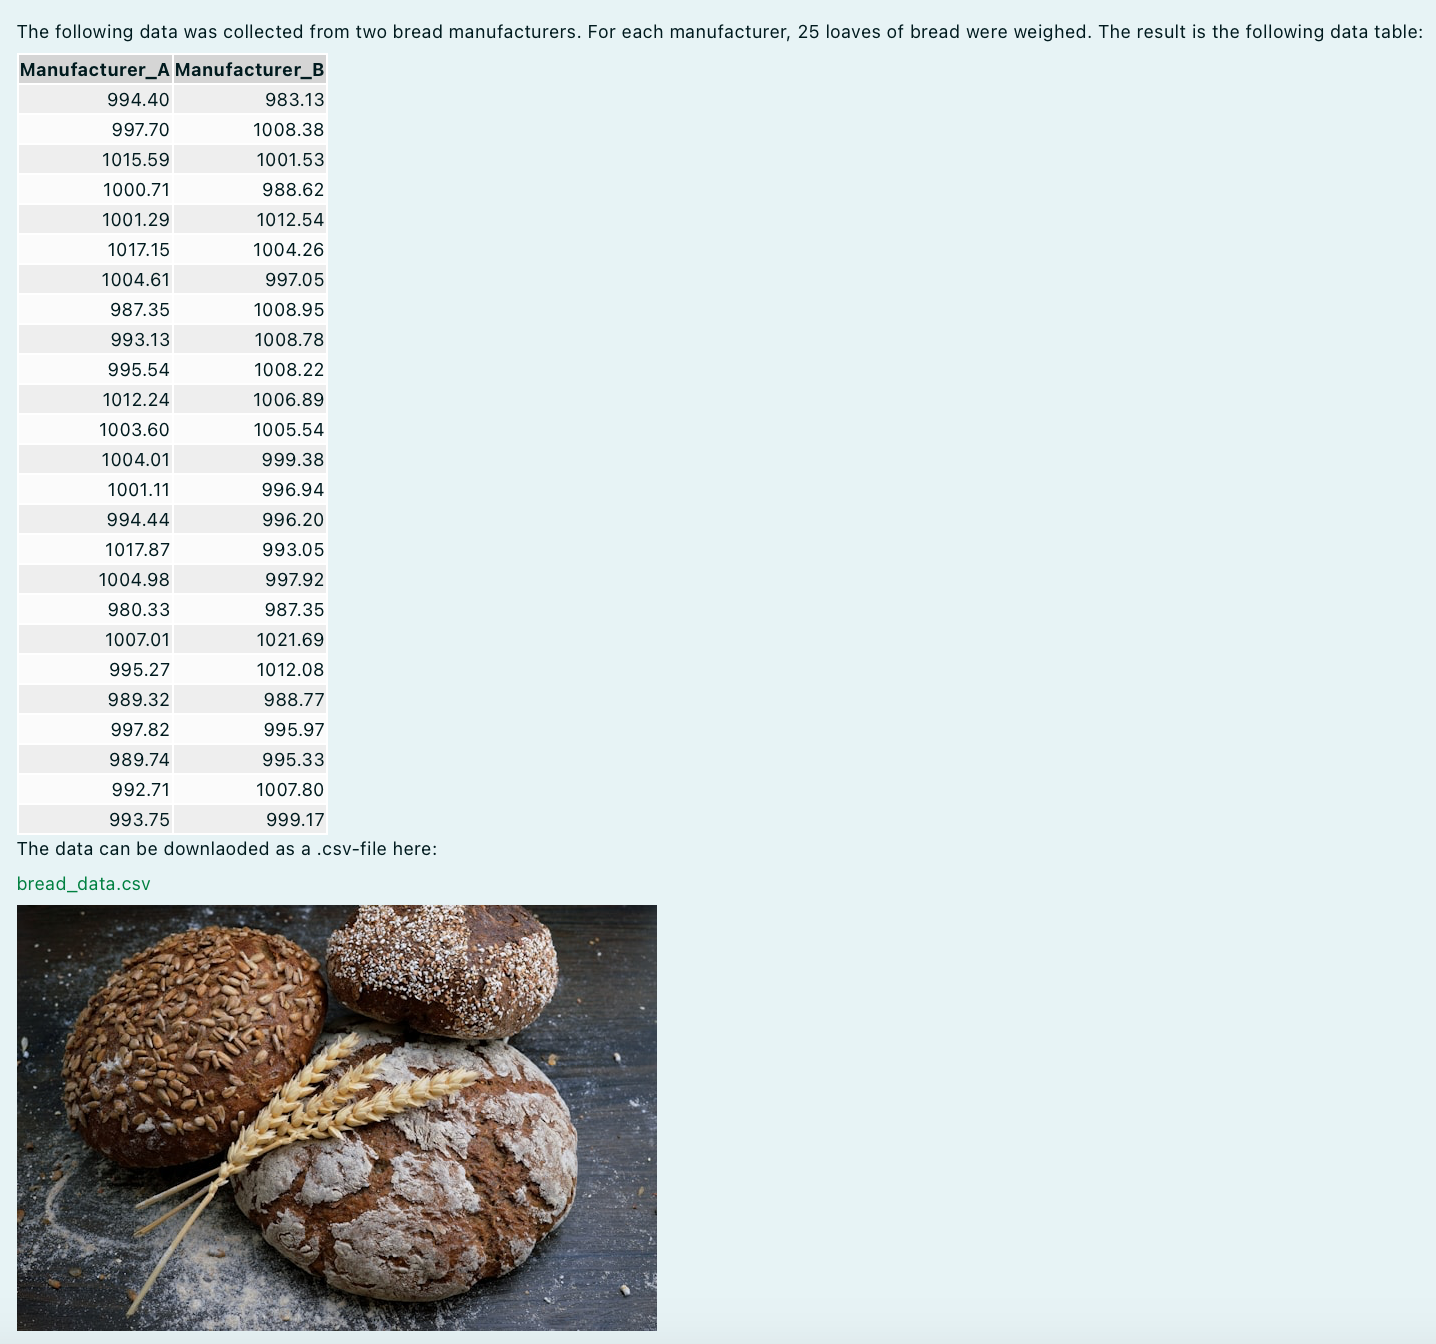
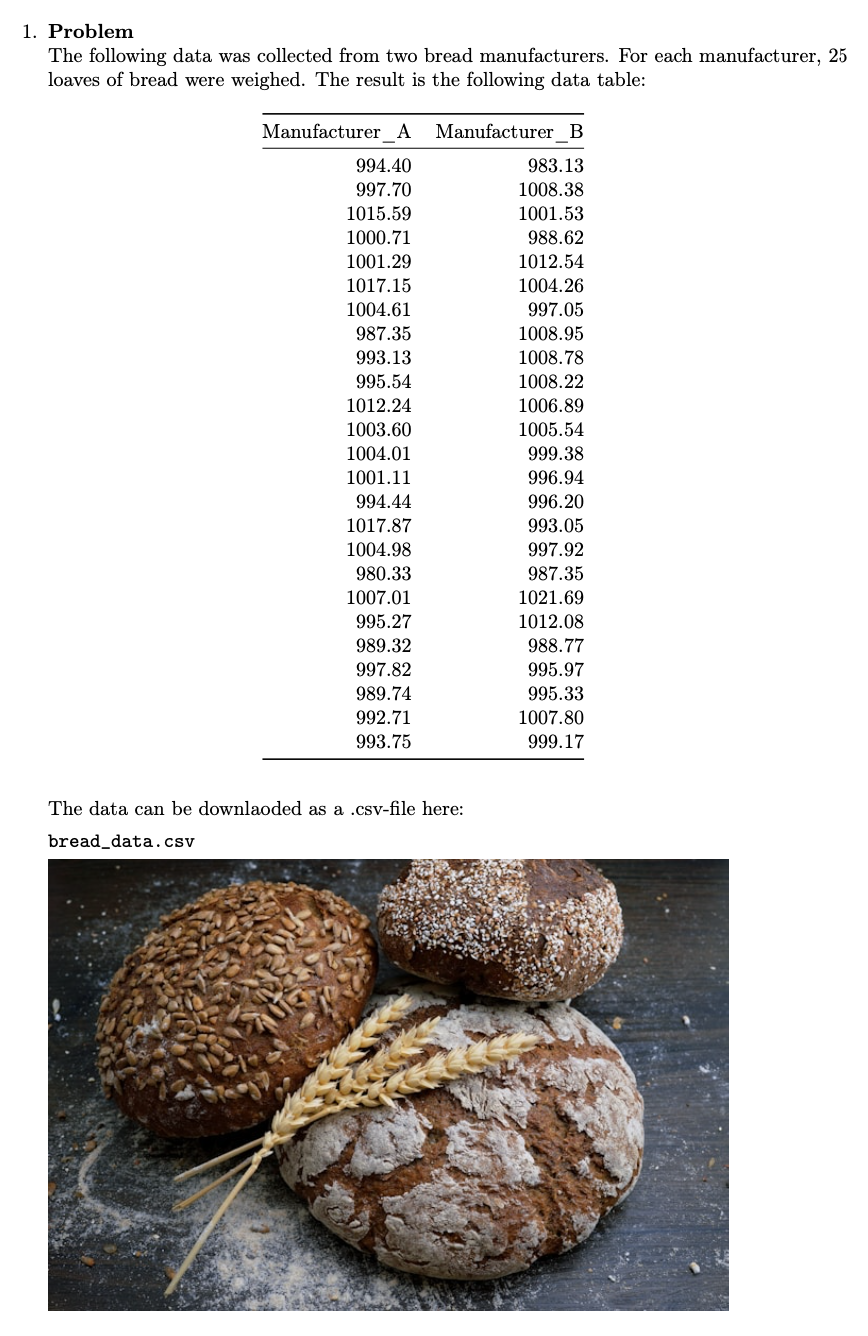
The following data was collected from two bread manufacturers. For each manufacturer, `r n` loaves of bread were weighed. The result is the following data table:
```{r, data table, echo = FALSE, results = "asis"}
kable(data)
```
The data can be downlaoded as a .csv-file here:
[bread_data.csv](bread_data.csv)

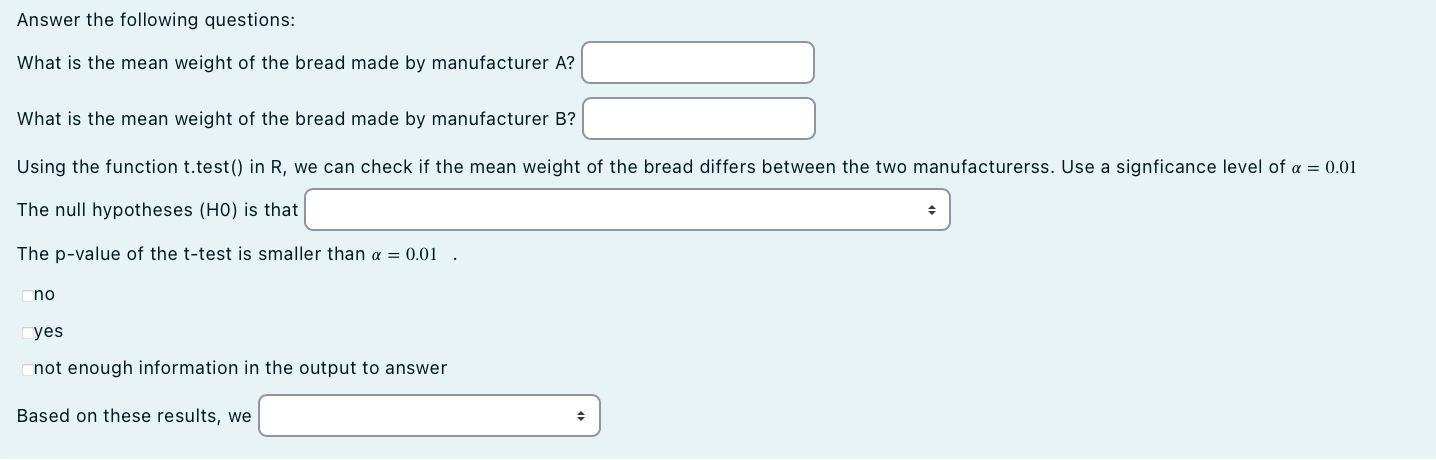
Answer the following questions:
What is the mean weight of the bread made by manufacturer A? ##ANSWER1##
What is the mean weight of the bread made by manufacturer B? ##ANSWER2##
Using the function t.test() in R, we can check if the mean weight of the bread differs between the two manufacturerss. Use a signficance level of $\alpha = `r alpha`$
The null hypotheses (H0) is that ##ANSWER3##
The p-value of the t-test is smaller than $\alpha = `r alpha`$. ##ANSWER4##
Based on these results, we ##ANSWER5##
```{r answerlist, echo = FALSE, results = "asis"}
#necessary codeblock which creates an answerlist object from the answers list, which is needed for conversion
answerlist(unlist(answers), markup = "markdown") # answerlist for exams2html/exams2moodle created from answers list
```
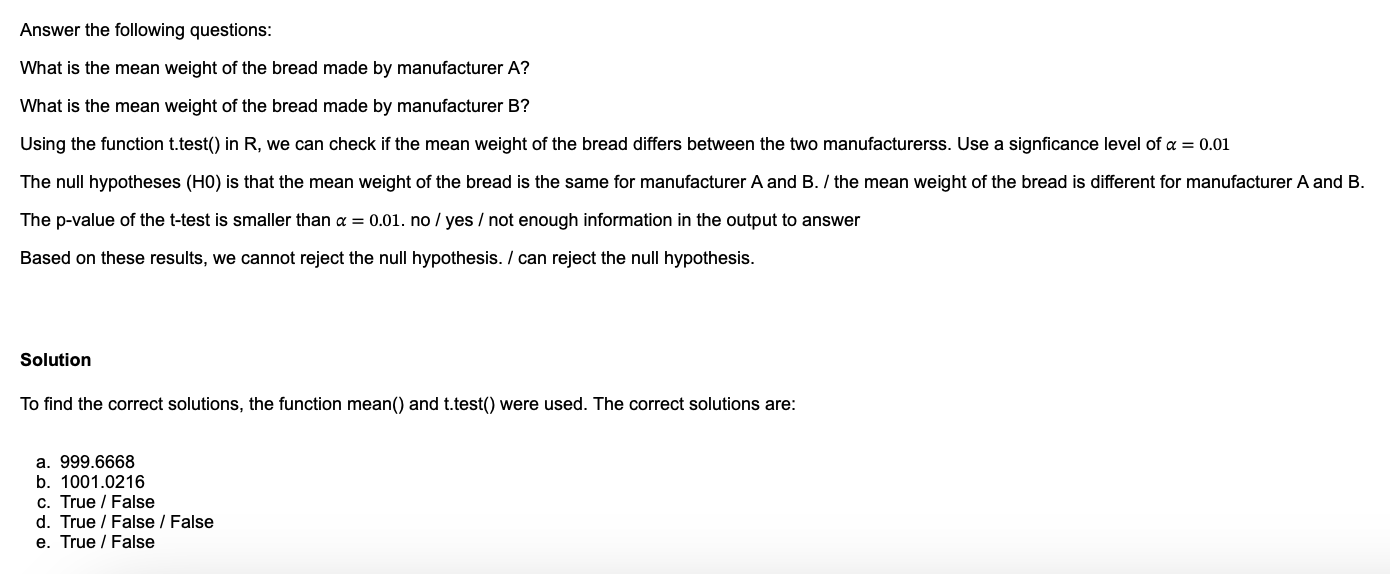
Solution
========
To find the correct solutions, the function mean() and t.test() were used. The correct solutions are:
```{r solutionlist, echo = FALSE, results = "asis"}
# feedback format changed from TRUE/FALSE in a vector to strings "True" and "False"
for (i in 1:length(solutions)) {
if (types[i] %in% c("schoice", "mchoice")) { # only applicable for schoice/mchoice questions
explanations[i] <- solutions[i] |> lapply(function(x) ifelse(x, "True", "False"))
} else {
explanations[i] <- solutions[i] #explanations are the same as solutions
}
}
#creates the explanations list needed for conversion
answerlist(unlist(explanations), markup = "markdown") # answerlist for exams2html/exams2moodle created from solutions/explanations list -> feedback
```
```{r meta, echo = FALSE, results = 'hide'}
# change solution format from TRUE/FALSE vector to 1/0 string
for (i in 1:length(solutions)) {
if (types[i] %in% c("schoice", "mchoice")) { # only applicable for schoice/mchoice questions
solutions[i] <- solutions[i] |>
unlist() |>
mchoice2string()
}
}
```
Meta-Information
================
exname: bread_exam
extitle: bread_exam
exsection: section_1/bread_exam
extype: cloze
exsolution: `r paste(solutions, collapse = "|")`
exclozetype: `r paste(types, collapse = "|")`
extol: `r paste(tolerances, collapse = "|")`
exshuffle: TRUE
exversion: v1
exextra[numwidth,numeric]: 16
exextra[stringwidth,numeric]: 16
After conversion with R/exams the exercise looks like this for different output types.
Warning
Please note that the embedded .csv-file, which is intended for Moodle/HTML output, cannot be downloaded from the pdf.
Data Generation
In this first code chunk the data for the example is generated from a normal distribution. Certain parameters are set by the user to create the desired exercise:
x_muis the mean used for sampling the first sample.alphais the confidence level for the t-test.difference, set toTRUEorFALSE, determines whether the means of the two groups are different or not.nis the number of observations for each sample.
Using these parameters, the mean of the second sample y_mu is defined and two samples are drawn. The data is put into a dataframe, and a .csv-file containing the data is created.
Important
Code needs to be placed within a code chunk within in an .Rmd-file to work correctly.
Question/solutionlist
In this code chunk, the necessary content (questions, solutions, tolerances etc.) is created. Lists are initalized and needed objects are defined. Question by question, the lists are filled out.
For question 3 to 5, the correct solution depends on the parameters that were chosen and the values that were calculated, so the solutions are adjusted dynamically.
Important
Code needs to be placed within a code chunk within in an .Rmd-file to work correctly.
#define empty lists
answers <- list()
solutions <- list()
types <- list()
explanations <- list()
tolerances <- list()

# define certain objects (not a necessary step, but a cleaner workflow for complex examples)
mean_x <- mean(x)
mean_y <- mean(y)
p_value <- t.test(x, y)$p.value

#mean manufacturer A
answers[[1]] <- "" #no answer options for numeric questions
solutions[[1]] <- mean_x
types[[1]] <- "num"
tolerances[[1]] <- 0.1 #tolerances only for numeric questions

#mean manufacturer B
answers[[2]] <- ""
solutions[[2]] <- mean_y
types[[2]] <- "num"
tolerances[[2]] <- 0.1

#null hypothesis
answers[[3]] <- c("the mean weight of the bread is the same for manufacturer A and B.", "the mean weight of the bread is different for manufacturer A and B.")  #answer options for single choice
solutions[[3]] <- if(difference){ c(FALSE, TRUE)} else {c(TRUE, FALSE)} #answer dynamically adjusted depending on the parameters used
types[[3]] <- "schoice" # single choice

#p-value
answers[[4]] <- c("yes", "no", "not enough information in the output to answer")
solutions[[4]] <- if(p_value < alpha){ c(TRUE, FALSE, FALSE)} else{ c(FALSE, TRUE, FALSE)} # answer dynamically adjusted
types[[4]] <- "mchoice" # multiple choice

#reject/accept
answers[[5]] <- c("can reject the null hypothesis.", "cannot reject the null hypothesis.")
solutions[[5]] <- if(p_value < alpha){c(TRUE, FALSE)} else{c(FALSE, TRUE)}
types[[5]] <- "schoice"
Question
This section gives a bit of context and the questions themselves and it display the data, provides a .csv-file and formats the answerlist of the answer options for conversion.
Question
========
The following data was collected from two bread manufacturers. For each manufacturer, `r n` loaves of bread were weighed. The result is the following data table:
```{r, data table, echo = FALSE, results = "asis"}
kable(data)
```
The data can be downlaoded as a .csv-file here:
[bread_data.csv](bread_data.csv)

Answer the following questions:
What is the mean weight of the bread made by manufacturer A? ##ANSWER1##
What is the mean weight of the bread made by manufacturer B? ##ANSWER2##
Using the function t.test() in R, we can check if the mean weight of the bread differs between the two manufacturerss. Use a signficance level of $\alpha = `r alpha`$
The null hypotheses (H0) is that ##ANSWER3##
The p-value of the t-test is smaller than $\alpha = `r alpha`$. ##ANSWER4##
Based on these results, we ##ANSWER5##
```{r answerlist, echo = FALSE, results = "asis"}
#necessary codeblock which creates an answerlist object from the answers list, which is needed for conversion
answerlist(unlist(answers), markup = "markdown") # answerlist for exams2html/exams2moodle created from answers list
```Solution
The solution section provides the feedback, in this case the correct solutions (without additional context). Using the function answerlist(), the explanations are formatted correctly for conversion. Additionally, for single/multiple choice questions, the TRUE/FALSE values in the explanations are written as “True” and “False”. The solutions these quesions need to be converted to a “1/0” format.
Solution
========

To find the correct solutions, the function mean() and t.test() were used. The correct solutions are:

```{r solutionlist, echo = FALSE, results = "asis"}
# feedback format changed from TRUE/FALSE in a vector to strings "True" and "False"
for (i in 1:length(solutions)) {
  if (types[i] %in% c("schoice", "mchoice")) { # only applicable for schoice/mchoice questions
    explanations[i] <- solutions[i] |> lapply(function(x) ifelse(x, "True", "False"))
  } else {
    explanations[i] <- solutions[i] #explanations are the same as solutions
  }
}

#creates the explanations list needed for conversion
answerlist(unlist(explanations), markup = "markdown") # answerlist for exams2html/exams2moodle created from solutions/explanations list -> feedback
```

```{r meta, echo = FALSE, results = 'hide'}

# change solution format from TRUE/FALSE vector to 1/0 string
for (i in 1:length(solutions)) {
  if (types[i] %in% c("schoice", "mchoice")) { # only applicable for schoice/mchoice questions
    solutions[i] <- solutions[i] |>
      unlist() |>
      mchoice2string()
  }
}
```
Meta-Information
The meta-information contains all the necessary information for conversion. exsection is used for the import in Moodle and allows the exercises to be imported automatically in the specified category. The extra arguments regarding numwidth and stringwidth specify the length of the answer boxes that are shown in Moodle.
Meta-Information
================
exname: bread_exam
extitle: bread_exam
exsection: section_1/bread_exam
extype: cloze
exsolution: `r paste(solutions, collapse = "|")`
exclozetype: `r paste(types, collapse = "|")`
extol: `r paste(tolerances, collapse = "|")`
exshuffle: TRUE
exversion: v1
exextra[numwidth,numeric]: 16
exextra[stringwidth,numeric]: 16